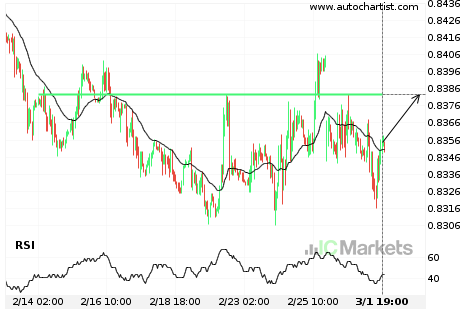
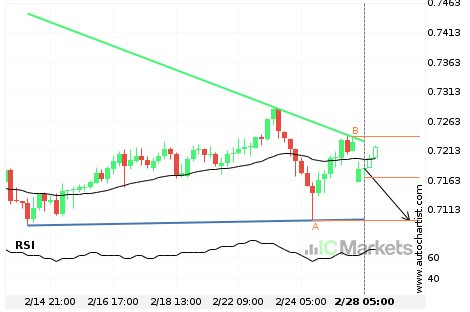
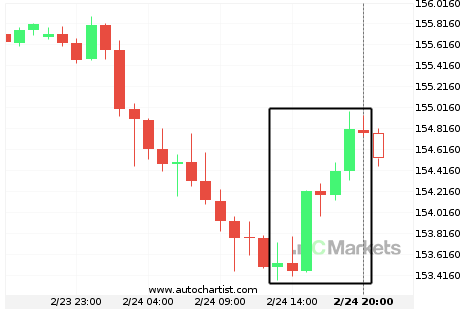
Breach of important price line imminent by EURGBP
EURGBP is moving towards a line of 0.8383 which it has tested numerous times in the past. We have seen it retrace from this position in the past, so at this stage it isn’t clear whether it will breach this price or rebound as it did before. If EURGBP continues in its current trajectory, we […]
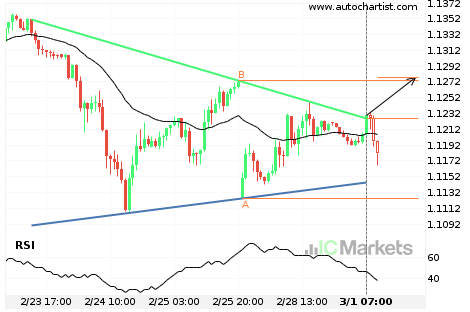
Should we expect a bullish trend on EURUSD?
The breakout of EURUSD through the resistance line of a Triangle could be a sign of the road ahead. If this breakout persists, we may see the price of EURUSD testing 1.1278 within the next 2 days.
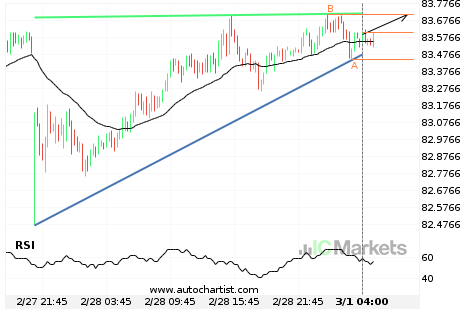
AUDJPY – getting close to resistance of a Ascending Triangle
AUDJPY is moving towards a resistance line. Because we have seen it retrace from this line before, we could see either a break through this line, or a rebound back to current levels. It has touched this line numerous times in the last 2 days and may test it again within the next 9 hours.
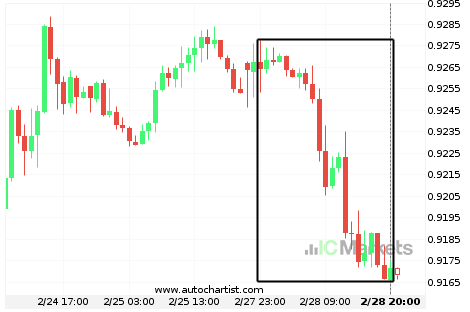
What’s going on with USDCHF?
Those of you that are trend followers are probably eagerly watching USDCHF to see if its latest 1% move continues. If not, the mean-reversion people out there will be delighted with this exceptionally large 21 hours move.
AUDUSD – getting close to support of a Descending Triangle
AUDUSD is moving towards a support line. Because we have seen it retrace from this line before, we could see either a break through this line, or a rebound back to current levels. It has touched this line numerous times in the last 15 days and may test it again within the next 3 days.
EURCHF experienced an exceptionally large movement
For those of you that don’t believe in trends, this may be an opportunity to take advantage of an exceptional 0.99% move on EURCHF. The movement has happened over the last 3 days. For those trend followers among you, you may think about riding this possible trend.
Where is AUDJPY moving to?
A movement of 1.16% over 20 hours on AUDJPY doesn’t go unnoticed. You may start considering where it’s heading next, a continuation of the current upward trend, or a reversal in the previous direction.
A possible start of a bullish trend on USDJPY
USDJPY has broken through a resistance line of a Falling Wedge chart pattern. If this breakout holds true, we may see the price of USDJPY testing 116.0310 within the next 3 days. But don’t be so quick to trade, it has tested this line in the past, so you should confirm the breakout before taking […]
What’s going on with AUDUSD?
Those of you that are trend followers are probably eagerly watching AUDUSD to see if its latest 1.46% move continues. If not, the mean-reversion people out there will be delighted with this exceptionally large 14 hours move.
Where is GBPJPY moving to?
A movement of 0.81% over 7 hours on GBPJPY doesn’t go unnoticed. You may start considering where it’s heading next, a continuation of the current upward trend, or a reversal in the previous direction.

